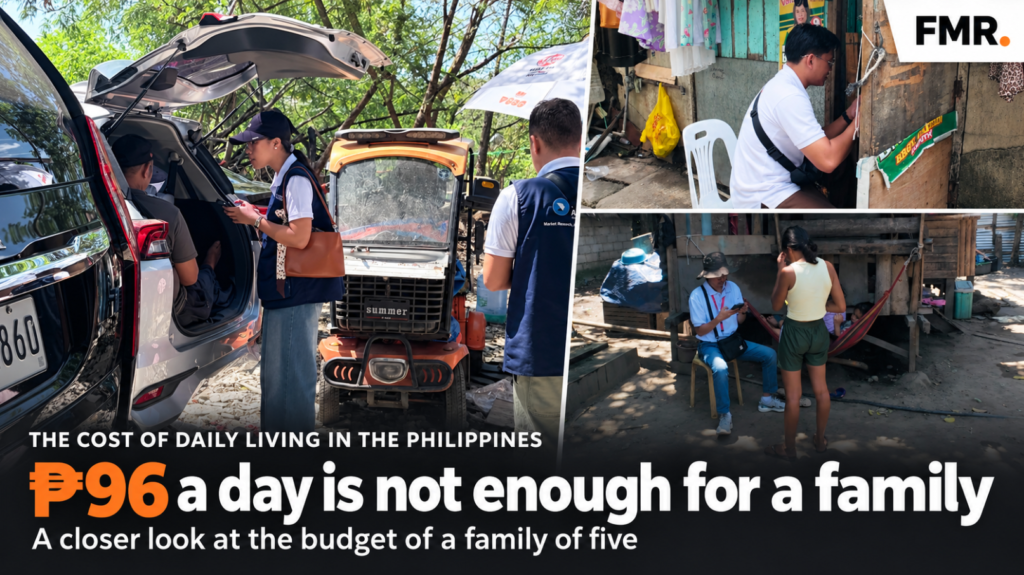
What does it take for a Filipino family of five to live each day?
An FMR perspective on household budgets, financial strain and the cost of essentials in the Philippines • Information cut-off: 31 October 2026 FMR Technological and Digital Advertising Services | Field Market Research | Operating in the Philippines since 2007, according to company information. The essential distinction: ₱96 is per person, not per family A family […]
By Bryan Cinco
An FMR perspective on household budgets, financial strain and the cost of essentials in the Philippines • Information cut-off: 31 October 2026
FMR Technological and Digital Advertising Services | Field Market Research | Operating in the Philippines since 2007, according to company information.
The essential distinction: ₱96 is per person, not per family
A family of five cannot reasonably use ₱96 as its entire daily living budget. But that is also not what the latest Philippine Statistics Authority (PSA) poverty threshold says. PSA’s preliminary 2025 national poverty threshold is ₱14,634 per month for a family of five. Annualizing that amount gives approximately ₱481 per household per day, or ₱96.22 per person per day. Dividing the monthly figure by 30 instead gives ₱487.80 per household per day. The difference is a calendar convention, not a different poverty standard. [1]
The threshold covers basic food and non-food needs; it is not a food-only allowance, a recommended salary, or a promise of comfortable living. It also describes 2025 conditions, not an October 2026 household shopping basket. It should not be used to dismiss a family’s experience of rent, transport, education and medical costs.
FMR proposes ₱900 a day—₱27,000 over a 30-day month—as a practical planning benchmark for the household described here. It is a company position, not an officially calculated living wage or a proven minimum for every Philippine location. The illustrative ₱600–₱1,000 budgets below have a midpoint of ₱800. Those two statements serve different purposes: ₱800 demonstrates the arithmetic of constrained spending, while ₱900 allows some additional room for essential needs.
Why October 2026 feels difficult
PSA reported September 2026 headline inflation of 7.2%, with food inflation at 6.8%, transport at 14.6%, and housing, water, electricity, gas and other fuels at 8.4%. Rice inflation was 20.3%. These are changes in price indices, not the price of every item or the increase experienced by every family. September is the latest monthly inflation release used in this article; no October full-month inflation figure is assumed. [2]
A household may therefore feel squeezed even when its income rises. Essential purchases absorb money before families can save, replace an appliance, pay for treatment or respond to a school expense. The impact depends on where the family lives, its rent, its commute, the ages of its children and whether either earner has steady paid work.
What FMR’s research summary covers
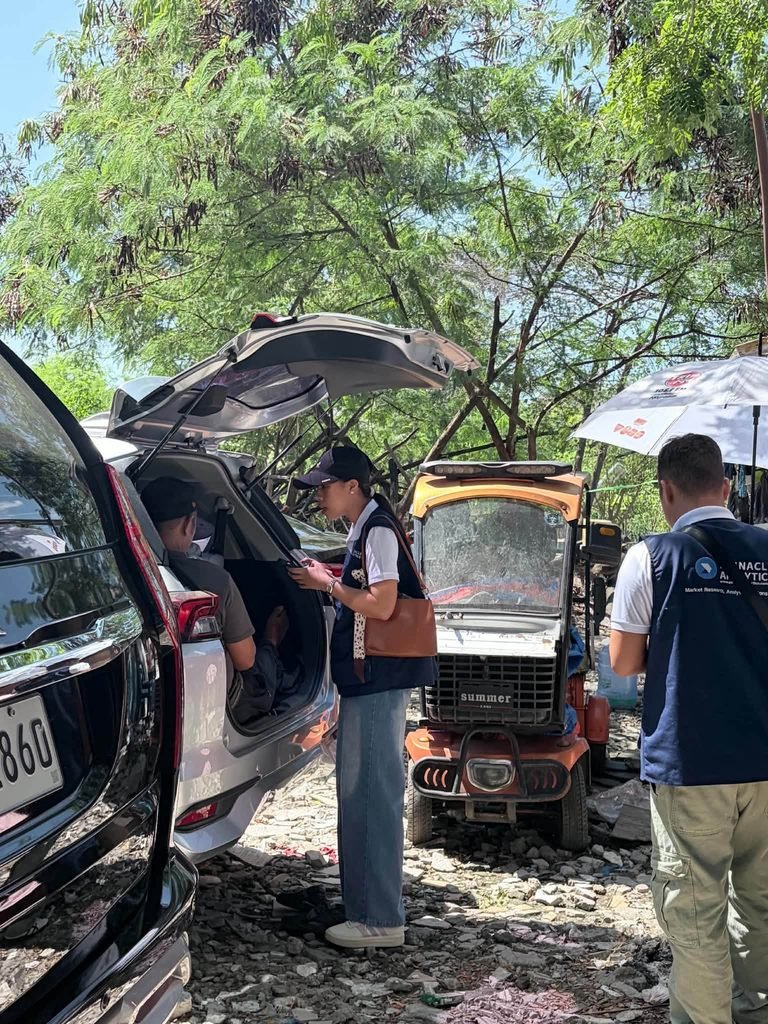
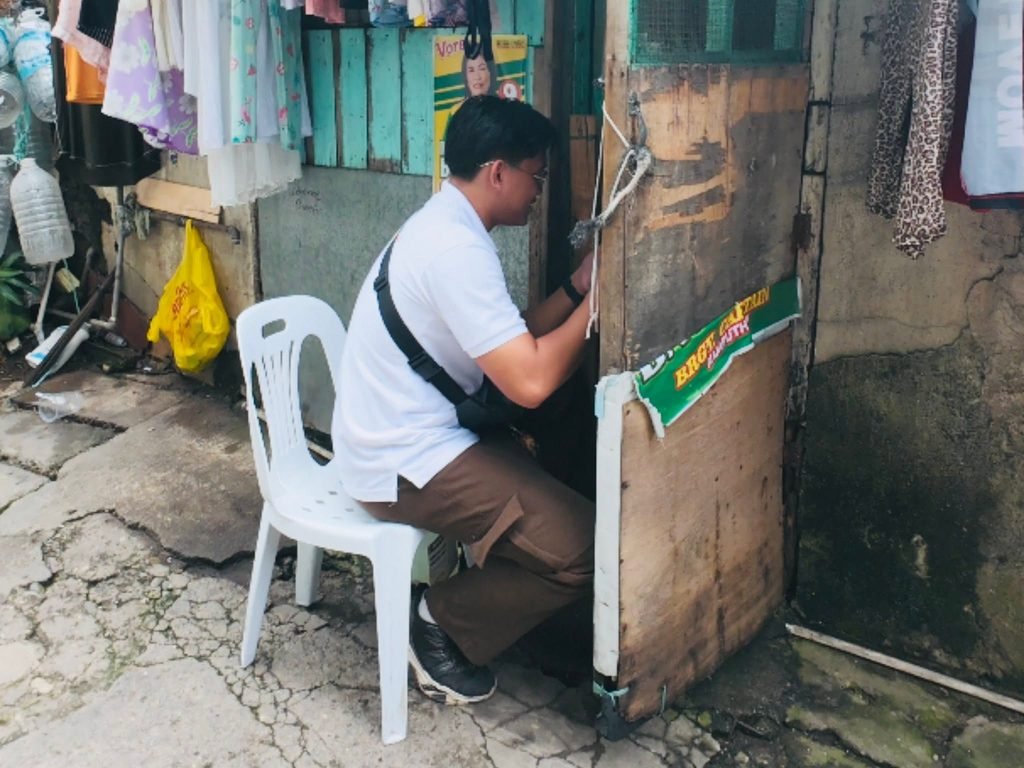
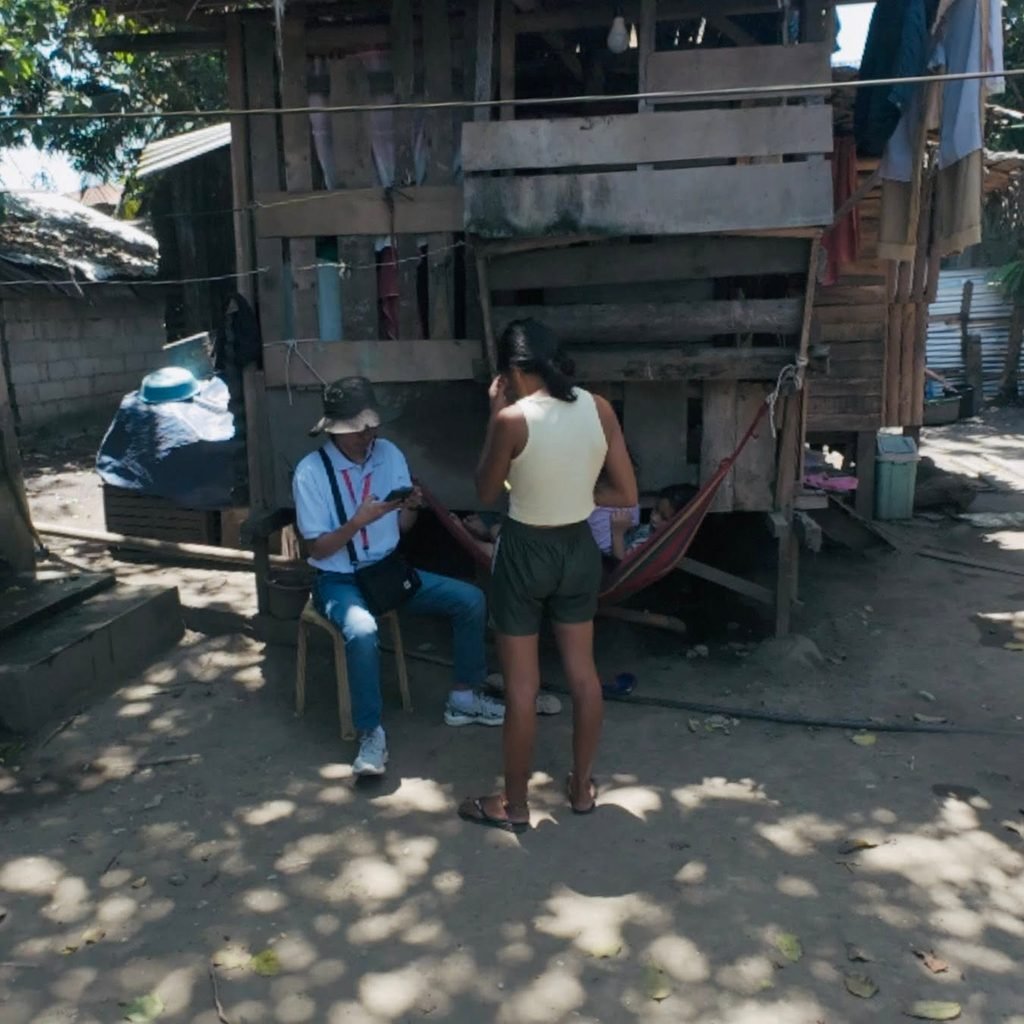
FMR reports 1,200 CAPI interviews and 600 CAWI interviews across the following locations. CAPI means computer-assisted personal interviewing; CAWI means computer-assisted web interviewing. The allocations below follow the company’s supplied fieldwork description.
Mode
Locations
Interviews per location
Total
CAPI
Metro Manila; Southern Luzon; Northern Luzon; Cebu; Davao
240 each (20% of CAPI)
1,200
CAWI
Cagayan de Oro; Bicol Region; Cotabato area; Iloilo area; CAR
120 each (20% of CAWI)
600
The combined total is 1,800 interviews. Each CAPI location represents 13.33% of the combined interview count; each CAWI location represents 6.67%. These allocations are not population weights. The information supplied does not establish whether all interviews represent unique households, whether every household contains five members, or the exact field dates and geographic boundaries.
Reported hardship and earners
In FMR’s supplied summary, approximately 70–80% of respondents described themselves as poor or said that living conditions were very difficult. This is a company-reported range rather than an audited estimate from a response table. The precise percentage, question wording, response categories and denominator should be confirmed before publication as a formal survey statistic. “Poor” and “living very hard” may overlap and should not be added together.
This is self-described financial strain. It is different from PSA’s income-based poverty classification. PSA’s preliminary 2025 estimate was 6.4% of families below the official poverty threshold. The populations, questions, dates and methods differ, so the two figures cannot be treated as directly comparable measurements. [1]
FMR also describes a typical five-person household in its summary as having two earners. The discussion below uses two earners as a working household scenario. It does not establish that two is the measured national average, or that both earners work every day.
What the research can and cannot establish
The supplied coverage can provide useful directional insight across varied locations. It does not by itself support a nationally representative poverty rate or household expenditure average. Online access may affect CAWI participation, while mode and location are intertwined in this design. Income, household size, rental status and employment type also need to be examined before comparing regions.
No respondent-level data, questionnaire, field dates, weighting file or tabulated expenditure results were available for this article. Accordingly, FMR’s reported observations are attributed to its summary, and all budgets in the following pages are explicitly illustrative. No respondent quotations or measured regional averages have been invented.
An illustrative daily household budget
For a family of five • Philippine pesos • Monthly bills converted into daily provisions using a 30-day planning month. These are constructed budgets, not survey means or a nutrition-tested minimum.
Expense
Constrained
Midpoint
Higher allowance
Food and drinking water
₱300
₱340
₱380
Transport—all household fares
₱50
₱85
₱120
Soap, toiletries and cleaning goods
₱20
₱30
₱40
Electricity
₱30
₱50
₱70
Water service
₱10
₱10
₱10
Cooking fuel / LPG provision
₱10
₱15
₱20
Mobile load / internet
₱10
₱15
₱20
School supplies / tuition provision
₱20
₱40
₱60
Rent / housing maintenance provision
₱140
₱185
₱230
Healthcare / medicines provision
₱10
₱20
₱30
Emergency reserve / savings
₱0
₱10
₱20
TOTAL PER DAY
₱600
₱800
₱1,000
30-DAY MONTH
₱18,000
₱24,000
₱30,000
Each midpoint is halfway between the two endpoints, so the middle column totals exactly ₱800. This is an arithmetic midpoint, not an estimate of average spending across the 1,800 interviews. It would be misleading to present these allocations as answers recorded in the survey.
Within the ₱800 budget, the food allowance is ₱340 for the household: ₱68 per person per day, or about ₱22.67 per person per meal if spread across three meals. This does not establish nutritional adequacy. The ₱185 housing provision is ₱5,550 a month, which may be inadequate for many rental arrangements. Public schooling can still require supplies and connectivity; private tuition may exceed the school provision substantially.
Where the proposed ₱900 benchmark goes
Add ₱100 to the midpoint: ₱40 for food, ₱20 for transport, ₱10 for schooling, ₱10 for healthcare and ₱20 for emergencies. The result is ₱900 daily or ₱27,000 monthly. Even this amount may be insufficient where rent is high, a child needs paid care, or a family member has a chronic illness. A ₱600 budget should be read as a constrained scenario, not evidence that all essential needs are met.
Transport covers household fares so that school travel is not counted again under schooling. Housing and utility costs depend on tenure and whether bills are shared. Debt repayments, childcare, remittances and major medical treatment are not fully funded in these examples and should be added where applicable.
What essential food costs in October 2026
Prices vary by market, variety, quality and date. The first table uses PSA national averages; the second uses a secondary compilation of selected NCR wet-market observations. They are separate reference baskets, not interchangeable national prices.
PSA reference item
₱ per kg
Observation period
Regular-milled rice
49.79
1–5 October
Pork meat with bones
290.85
1–5 October
Tilapia
185.27
1–5 October
Eggplant
104.41
1–5 October
Well-milled rice
56.25
15–17 October
Pork liempo
342.97
15–17 October
Galunggong
237.96
15–17 October
Baguio beans
157.76
15–17 October
Source: PSA agricultural commodity price situationers, released 16 and 30 October 2026 respectively. These are national average retail observations for the stated collection periods, not prices in every province. [3–4]
Selected NCR market item
₱ per kg
Selected NCR market item
₱ per kg
Whole dressed local chicken
204.79
Tomato
98.64
Local pork liempo
359.81
Sayote / chayote
52.86
Tilapia
157.30
Local carrot
153.78
Local galunggong
300.55
Native pechay
98.39
Squash / kalabasa (Suprema)
61.59
Ampalaya
115.71
Pole sitao
117.19
Local Baguio beans
127.74
Cabbage (Scorpio)
172.14
Local red onion
125.76
Imported garlic
151.87
Local ginger
196.06
Source: PH in Numbers’ compilation of Department of Agriculture observations dated 30 October 2026. These values were retrieved from the secondary compilation; the underlying daily DA PDF was not independently retrieved. They should be checked against the original DA bulletin before use as an official price release. Units above are pesos per kilogram. [5]
Why a shopping trip can consume ₱1,000 quickly
Using that same selected-NCR compilation, a basket of 5 kg regular-milled rice at ₱45.58/kg, 1 kg chicken, half a kilogram each of liempo, tilapia, tomato and sayote, plus a quarter kilogram each of carrots and red onions, costs about ₱837. It excludes cooking oil, seasonings, fruit, breakfast items and household supplies. This is a shopping-basket illustration—not a daily consumption recommendation or a balanced meal plan. [5]
The burden also depends on how people shop. Small purchases can help a cash-constrained household get through today, while leaving little room to buy in bulk. Food spoilage, storage and refrigerator electricity can affect which purchases are practical.
Transport, fuel and utilities
Expense
Dated reference
What it means for a household
Traditional jeepney minimum fare
₱14; September 2026 government report
Two earners making two minimum-fare boardings each spend ₱56 per workday.
Modern jeepney minimum fare
₱17; same government report
Transfers, longer trips and school journeys add to the minimum.
Meralco residential reference
₱15.0615/kWh; October 2026
At the published reference rate, 200 kWh is approximately ₱3,012 monthly, or ₱100/day.
Maynilad average basic charge
₱52.86/m³ in its October FCDA notice
A basic-charge reference, not a universal all-in residential tariff.
Fare source: Philippine Information Agency, 28 September 2026. Discounts for eligible passengers and distance rules affect actual fares. Tricycle charges vary locally and app fares vary by route and demand; neither has one nationwide minimum quoted here. [6]
Four minimum-fare traditional-jeepney boardings per worker—for example, a transfer each way—would cost two workers ₱112 per workday. Over 26 working days that is ₱2,912, equivalent to about ₱97 per calendar day in a 30-day budget, before any other household travel.
Meralco’s October rate is a published residential reference; actual bills vary with consumption, billing components and applicable subsidies. It is not a national electricity tariff. At approximately 100 kWh, that reference rate would be about ₱1,506 monthly, explaining why the ₱50/day electricity provision in the midpoint budget assumes relatively low usage. [7]
Maynilad’s notice effective 1 October 2026 stated an average basic charge of ₱52.86 per cubic metre and an FCDA rebate averaging about ₱0.01/m³. Residential blocks, other charges and consumption determine the actual bill. The ₱300 monthly water provision in the model is an assumption, not a calculated Maynilad bill. Other water districts and providers charge differently. [8]
Fuel: distinguish pump prices from weekly changes
A secondary compilation of DOE NCR observations for 13–19 October lists common pump prices of ₱89.60/litre for RON 91 gasoline, ₱97.20 for RON 95, ₱91.30 for diesel and ₱122.70 for kerosene. These are dated reference prices, not verified 31 October prices at every station. [9]
Separately, the Philippine News Agency reported adjustments effective 27 October of minus ₱0.30/litre for gasoline, plus ₱1.20 for diesel and plus ₱0.50 for kerosene. A weekly adjustment is not a complete retail price; it should not be mechanically added to an earlier national or NCR average to claim a current station price. [10]
Fuel costs affect families directly when they own a vehicle and indirectly through transport and deliveries. A household should avoid double-counting both public-transport fares and a full private-vehicle fuel allowance unless it actually uses both. LPG should be budgeted from local cylinder prices and the household’s replacement interval; no unverified October cylinder price is asserted here.
Two earners do not remove financial pressure
A household with two earners must still support five people, including three who may have no independent income. Paid workdays are different from calendar days: food, rent and utilities continue on weekends, holidays and days without work.
Daily household budget
30-day requirement
Required earnings per worker per paid day*
₱800
₱24,000
₱461.54
₱900
₱27,000
₱519.23
₱1,000
₱30,000
₱576.92
*Two earners, each paid for 26 days. These figures are arithmetic before payroll deductions and assume the household has no additional unfunded expenses. They are not wage recommendations.
The NWPC NCR wage page lists a ₱755 daily non-agricultural minimum effective 26 September 2026, with different rates for specified categories. Two workers receiving ₱755 for 26 days would earn ₱39,260 monthly before deductions—about ₱1,309 per calendar day over 30 days. This is an NCR illustration and should not be applied as the wage rate in Cavite, Laguna, Bulacan, Pampanga or every occupation. [11]
Metro Manila, Cavite, Laguna, Bulacan and Pampanga
FMR’s supplied account highlights households in these urban and peri-urban areas with combined earnings around ₱1,500–₱1,700 a day. Without regional income tables, this should be described as an indicative household scenario, not the average income of all families in these provinces. Nor does it establish that households elsewhere earn less.
If ₱1,500–₱1,700 refers to combined earnings on 26 paid days, it produces ₱39,000–₱44,200 a month, equivalent to approximately ₱1,300–₱1,473 per calendar day. If it refers to income received every calendar day, the monthly total is instead ₱45,000–₱51,000. The definition materially changes affordability.
This constructed urban budget totals ₱48,000 per 30-day month. A household earning ₱1,600 on each of 26 working days would receive ₱41,600 before deductions, leaving a ₱6,400 gap against that scenario. The illustration explains how relatively high daily earnings can coexist with financial strain; it is not a measured provincial expenditure average.
“₱1,000 feels like ₱400” describes strain, not an index
The phrase captures the experience of money disappearing quickly after essential purchases. It should not be presented as a statistically measured 60% loss of purchasing power. That claim would require a defined comparison date and a matched basket of goods. Rent, transfers, medicines and school needs can leave little discretionary cash even when take-home income looks substantial.
The costs a daily total can hide
Housing, access and unpaid time
An owner-occupier, a renter and a household sharing accommodation face different cash demands. A lower rent farther from work can be offset by extra fares, travel time and childcare. Time spent commuting, fetching water, caring for relatives or queuing for services also limits earning opportunities, even when it does not appear as a cash expense.
Health, children and irregular payments
Routine medicines, consultations, dental care and emergencies can overwhelm a small daily provision. School expenses arrive unevenly: enrolment-related purchases, uniforms, projects, devices and connectivity may fall together. Public-school access does not eliminate these costs. Private tuition, disability-related needs and paid childcare require separate household-specific allowances.
Employment security, debt and exposure to shocks
Two nominal earners may not mean two stable salaries. Irregular shifts, seasonal work, unpaid absences and illness can reduce the number of paid days. Debt repayments and interest reduce spendable income, while remittances may support relatives beyond the five-person household. Floods, typhoons, crop disruption and damage to housing or work equipment can add sudden costs. These risks are reasons to include a reserve, rather than proof of a particular survey finding.
What FMR should measure next
A stronger expenditure release would report the survey dates and exact questions, deduplicate respondents, confirm household size and earners, and distinguish gross income, take-home pay and disposable resources. Daily, weekly and monthly expenses should be converted consistently. Medians and ranges should accompany means because a small number of high-cost households can change the average.
Separate tables should compare location, mode, household size, tenure, employment status and school-age children. Income and expense distributions are more informative than a single national-looking number. Any population inference requires a documented sampling frame, selection method and appropriate weights. A precise 70–80% hardship finding should be released only after its underlying frequency table and wording are verified.
FMR’s position
The useful question is not whether a family can be told to survive on a threshold. It is whether the household can meet food, shelter, transport, education and health needs reliably, with some protection against setbacks. For the five-person scenarios in this article, ₱800 a day represents constrained budgeting, while ₱900 is FMR’s proposed planning benchmark. Urban housing and commuting, medical needs and irregular employment can push requirements well beyond either amount.
FMR’s reported fieldwork gives a basis for discussing lived financial strain. Keeping those observations separate from official statistics and constructed budgets makes the argument more credible—and gives families’ experiences a clearer place in decisions about wages, services and household support.
Prepared for FMR Technological and Digital Advertising Services fieldmarketresearch.com | info@fieldmarketresearch.com | +63 917 505 6625
Sources and publication notes
Official sources are used where available. Secondary compilations are expressly identified. Access and information cut-off: 31 October 2026. Commodity observations are not forecasts or guarantees of retail availability.
[1] PSA, Proportion of Poor Families Reduced to 6.4 Percent in 2025; press release and statistical tables, 21 August 2026.
Company-supplied material: FMR history, interview allocations, directional hardship range, two-earner description and indicative urban income scenario. These were not independently audited. Illustrative budgets were prepared for this article and must not be labelled as respondent-level results.
Bryan R. Cinco
Founder | Field Market Research Specialist
Bryan R. Cinco is the founder of FMR Technological and Digital Advertising Services, specializing in nationwide field market research, survey design, qualitative and quantitative studies, CATI, CAPI, mystery shopping, and data-driven insights for businesses and government organizations.
The global technology industry is entering a period in which location, supply-chain security, skilled manpower, political relationships, infrastructure, and market access are…